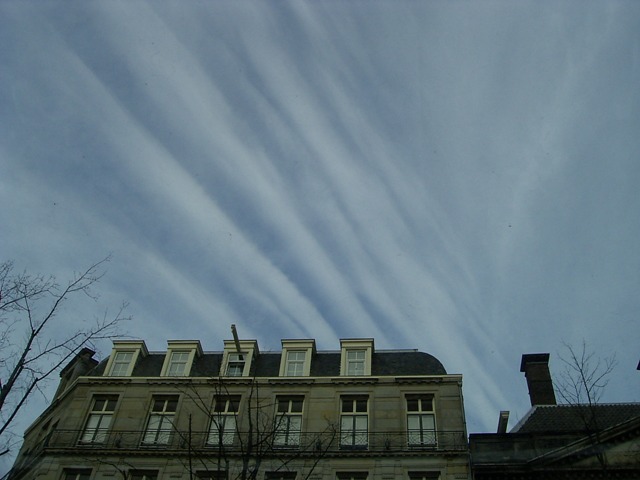
Cirrus radiatus Ci ra
Genus Cirrus, Variety radiatus
- Photo
- Stefan Bauer
- Location
- Amsterdam
- Taken
- 24 November 2007, 15:00
At the polar front, which separates warm subtropical air masses from cold polar air masses, a so-called jet stream occurs at altitude (about 11 km), characterized by high wind speeds. Cirrus radiatus clouds can form in this jet stream, as seen here in the photo. "Radiatus" means parallel streaks and bands.
The weather that day
Large-scale weather pattern
Cyclonic north-westerly NWz
Lows over Scandinavia and the Baltic bring cold maritime air from the north-west. Typical showery weather with cumulus congestus and cumulonimbus, sometimes graupel; rain or snow piles up on the north-western slopes of the uplands and the Alps.
Typical clouds in this pattern: Cumulus, Cumulonimbus, Stratocumulus, Nimbostratus
The weather pattern describes the flow over central Europe on that day – locally, the sky may have looked different.
The sky at nearby weather stations
In the photo: Cirrus radiatus · 15:00
As under “Identify”: ✓ = reported by a weather station, dots = estimated from height and cover (automatic measurement). The stations see their own sky – not necessarily the cloud in the photo.
Does the weather fit the cloud?
Cirrus – according to the reanalysis quite possible (13:00) · Why?
- Reanalysis (13:00), quite possible: High cloud 88 %. High ice clouds, not closed: cirrus.
Formation: Ice cloud at great height (usually above 6 km, below about −35 °C). Forms when moist air is lifted high up, or as left-over ice from convective clouds and contrails; falling crystals make the fibres.
Observation before model: what an observer at a weather station reported counts for more than an estimate from a station’s instruments and more than the weather model. Each piece of information counts for less the farther away the station and the further from the time of the photo; the strongest comes first. The ERA5 reanalysis (grid point at the photo location, about 25 km grid spacing) only knows the cover per étage and values at the ground – its level is a rough estimate.
Measurements at the time of the photo
- Temperature
- 7.0 °C · Dew point 1.0 °C
- Humidity
- 66 %
- Wind
- from the south-west, 31 km/h (Beaufort 5)
- Precipitation
- none measured
Air pressure fell by 2.7 hPa in the three hours before the photo was taken.
Sources: weather reports from the Integrated Surface Database of NOAA (NCEI), Schiphol (11 km SW); weather pattern after Hess/Brezowsky from the DWD catalogue GWL-REA; ERA5 reanalysis by Copernicus/ECMWF (CC BY 4.0) via Open-Meteo. Times in local time.
Similar photos
-
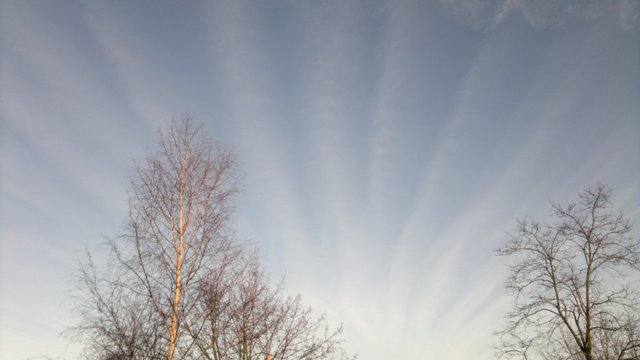 Cirrus radiatus Hucknall 2012
-
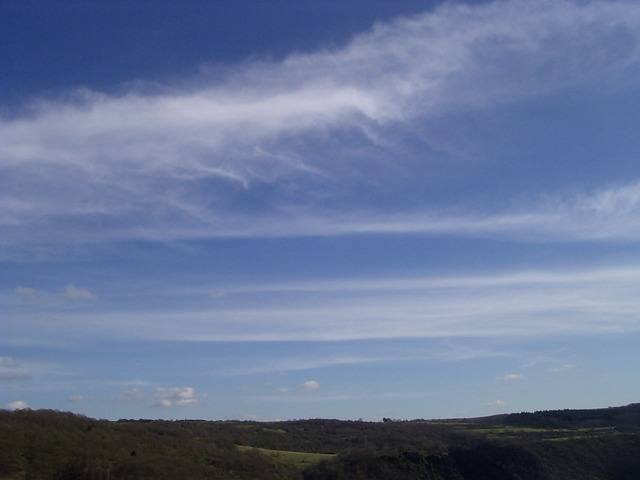 Cirrus radiatus St. Goarshausen 2007
-
 Cirrus fibratus Hankerton 2012
-
 Cirrocumulus mammatus, Cirrostratus fibratus, Cirrus fibratus Störmthaler Lake 2012
-
 Cirrus spissatus Darmstadt 2012
-
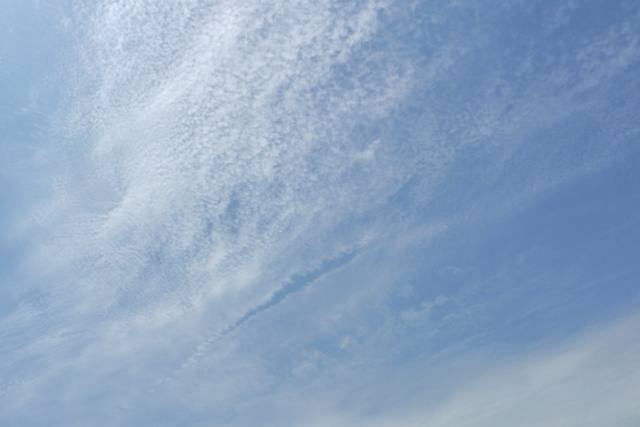 Cirrocumulus floccus lacunosus +2 Darmstadt 2012
-
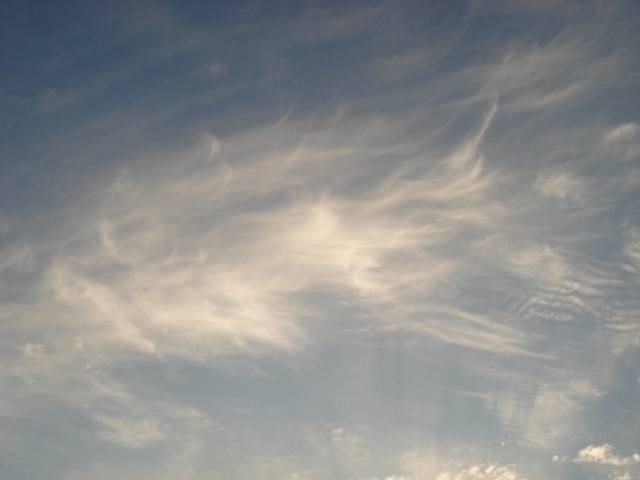 Cirrus fibratus +3 Atlanta 2012
-
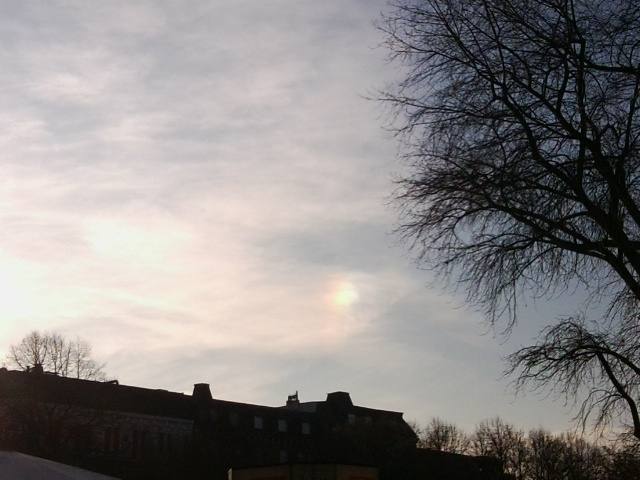 Sun dog +1 Hamburg 2011
Write a comment or ask a question about this photo
Every comment is read before it is published. Your email address is only needed for the confirmation link and a short message once the comment is online; it is deleted after that.