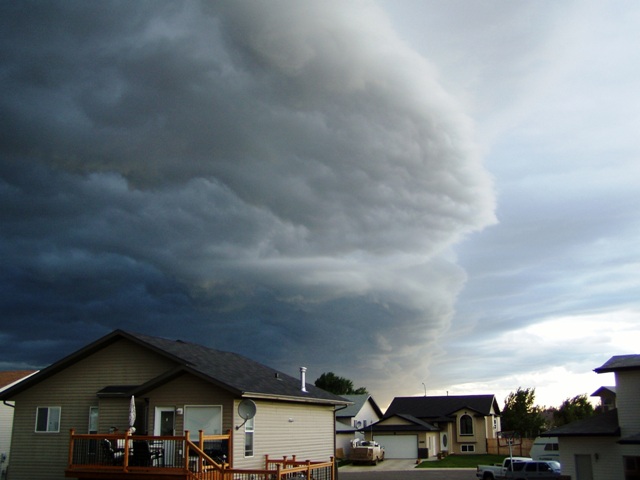
Cumulonimbus arcus Cb arc
Genus Cumulonimbus, Supplementary feature arcus
- Photo
- Richard Lafferty
- Location
- Grande Prairie, Canada
- Taken
- 18 July 2005
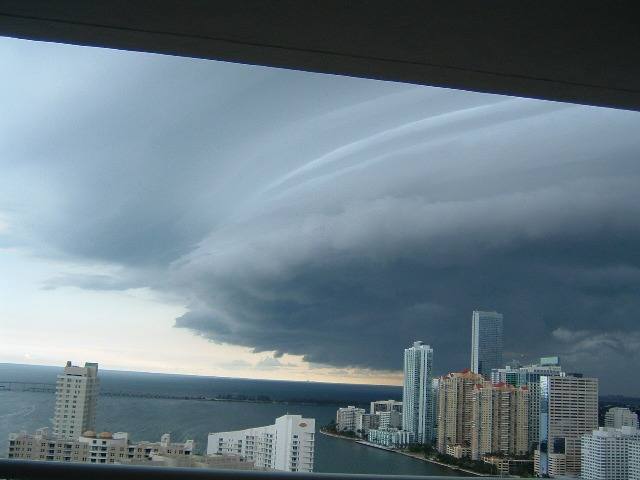
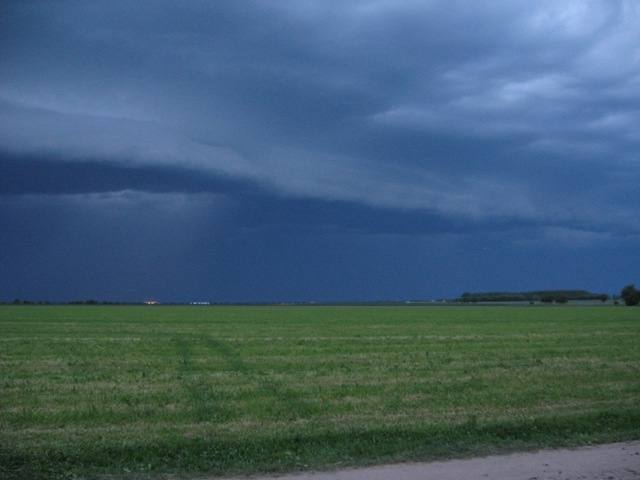
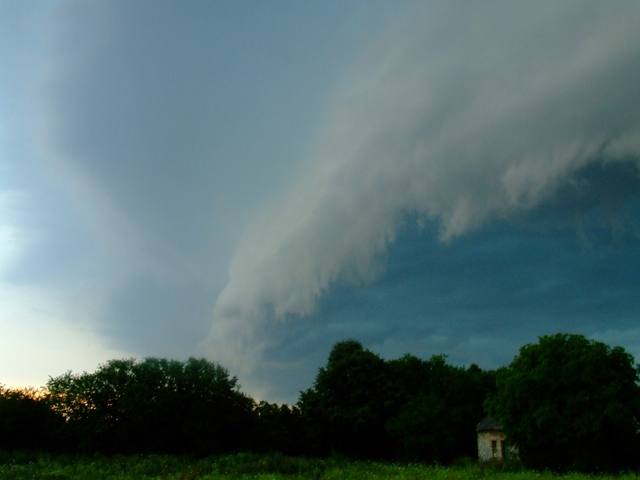
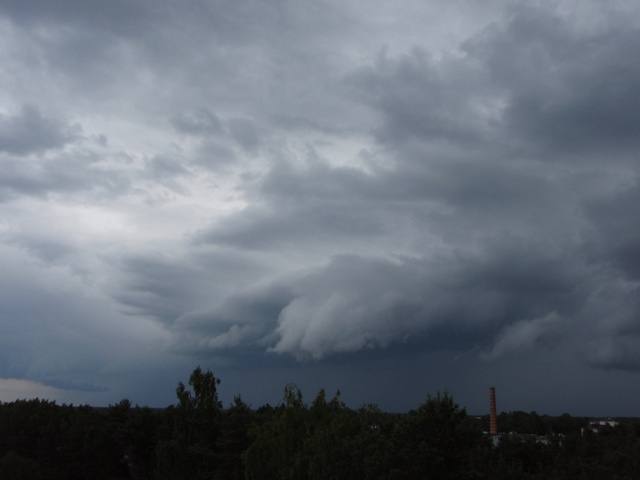
On the right side of the image, the high anvil of a Cumulonimbus incus is visible from below, and in the lower layers (center and left of the image) a gust front roll (Cumulonimbus arcus).
The weather that day
The sky according to the reanalysis
In the photo: Cumulonimbus arcus
As under “Identify”: ✓ = reported by a weather station, dots = estimated from height and cover (automatic measurement). The stations see their own sky – not necessarily the cloud in the photo.
Does the weather fit the cloud?
Cumulonimbus – according to the reanalysis quite possible (18:00) · Why?
- Reanalysis (18:00), quite possible: 29 % low, 79 % middle, 55 % high cloud. In daytime thermals reach 1,550 m, the condensation level (dew-point spread 7.4 °C × 125 m) is at 900 m – rising air condenses. Plus 1.1 mm precipitation in the hour: the heap clouds grow tall enough to bring showers. A heavy shower (1.1 mm) in warm air: often from cumulonimbus. The reanalysis does not report thunder – hence only “quite possible”.
Formation: Thundercloud: a heap cloud grows to great heights in very unstable air; its summit glaciates (fibrous) and often spreads out as an anvil. Lightning, thunder, showers, hail.
Observation before model: what an observer at a weather station reported counts for more than an estimate from a station’s instruments and more than the weather model. Each piece of information counts for less the farther away the station and the further from the time of the photo; the strongest comes first. The ERA5 reanalysis (grid point at the photo location, about 25 km grid spacing) only knows the cover per étage and values at the ground – its level is a rough estimate.
Measurements that day
- Temperature
- 10.0 to 18.0 °C
- Precipitation
- 4.0 mm over the whole day
Between 14:00 and 16:00 the temperature dropped by 5.0 °C.
Sources: weather reports from the Integrated Surface Database of NOAA (NCEI), Beaverlodge Rcs Alta (38 km W); ERA5 reanalysis by Copernicus/ECMWF (CC BY 4.0) via Open-Meteo. Times in local time.

Write a comment or ask a question about this photo
Every comment is read before it is published. Your email address is only needed for the confirmation link and a short message once the comment is online; it is deleted after that.