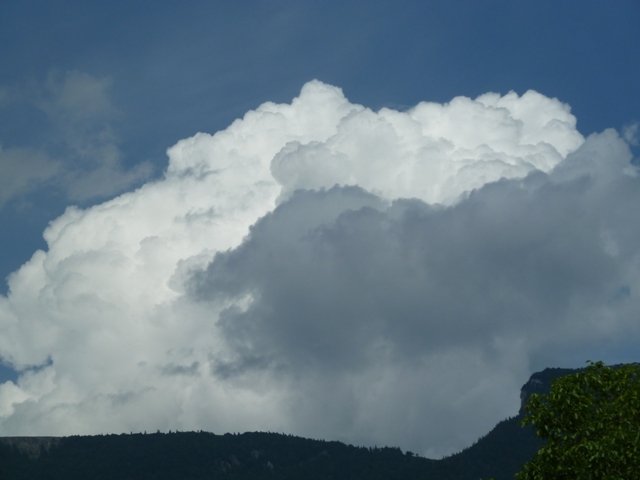
Cumulus congestus Cu con
Genus Cumulus, Species congestus
- Photo
- Rebecca Jenzer
- Location
- Selzach, Switzerland
- Taken
- 5 June 2011, 14:20
Massive Cumulus congestus. As soon as parts of the cloud at the top begin to fibrous, i.e. glaciate, it is called Cumulonimbus.
The weather that day
Large-scale weather pattern
Cyclonic southerly Sz
A low over western Europe sends warm, moist air from the south. Föhn on the northern side of the Alps with lens-shaped clouds, later fronts with altostratus and nimbostratus; thunderstorms in summer.
Typical clouds in this pattern: Altocumulus, Altostratus, Nimbostratus, Cumulonimbus
The weather pattern describes the flow over central Europe on that day – locally, the sky may have looked different.
The sky at nearby weather stations
In the photo: Cumulus congestus · 14:00
As under “Identify”: ✓ = reported by a weather station, dots = estimated from height and cover (automatic measurement). The stations see their own sky – not necessarily the cloud in the photo.
Does the weather fit the cloud?
Cumulus humilis – according to the reanalysis possible (14:00) · Why?
- Reanalysis (14:00), possible: 18 % low, 42 % middle, 59 % high cloud. In daytime thermals reach 1,500 m, the condensation level (dew-point spread 9.3 °C × 125 m) is at 1,150 m – rising air condenses. This usually produces separate heap clouds – too small for the reanalysis to show them as significant low cloud.
Formation: Heap cloud: warm air bubbles (thermals) rise, cool and condense at the condensation level – hence the flat base. How tall they grow depends on the instability above.
Observation before model: what an observer at a weather station reported counts for more than an estimate from a station’s instruments and more than the weather model. Each piece of information counts for less the farther away the station and the further from the time of the photo; the strongest comes first. The ERA5 reanalysis (grid point at the photo location, about 25 km grid spacing) only knows the cover per étage and values at the ground – its level is a rough estimate.
Sources: observations and measurements from Deutscher Wetterdienst, the German weather service (CC BY 4.0); weather pattern after Hess/Brezowsky from the DWD catalogue GWL-REA; ERA5 reanalysis by Copernicus/ECMWF (CC BY 4.0) via Open-Meteo. Times in local time.
Similar photos
-
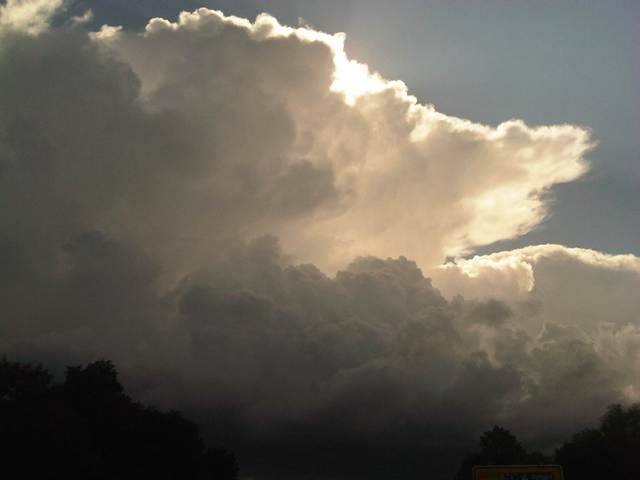 Cumulonimbus capillatus incus +1 District of Dachau 2012
-
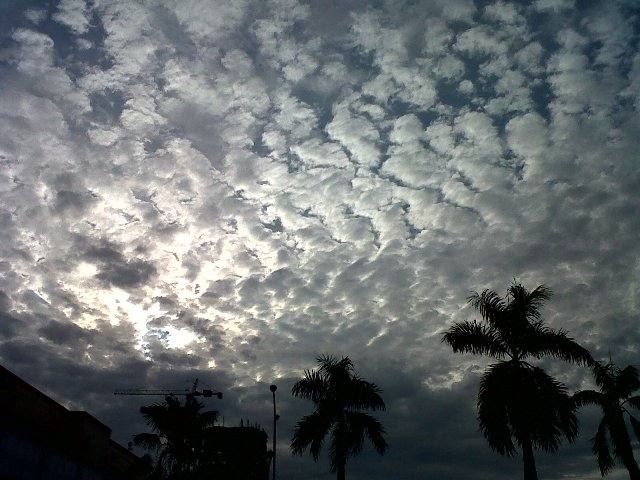 Altocumulus stratiformis perlucidus translucidus undulatus +2 Jakarta 2011
-
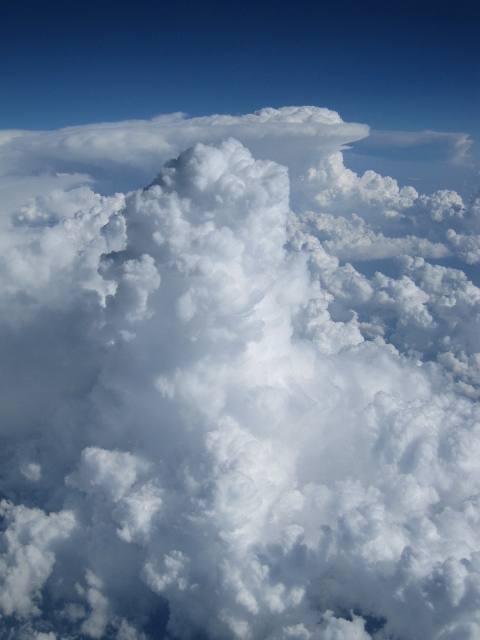 Cumulus mediocris +2 over Hungary 2011
-
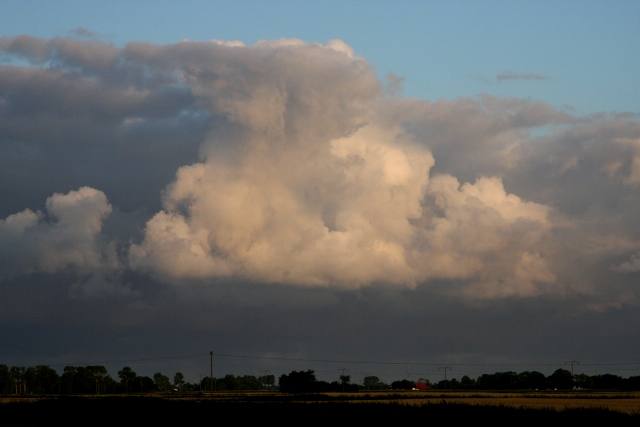 Cumulus congestus Sankt Michaelisdonn 2009
-
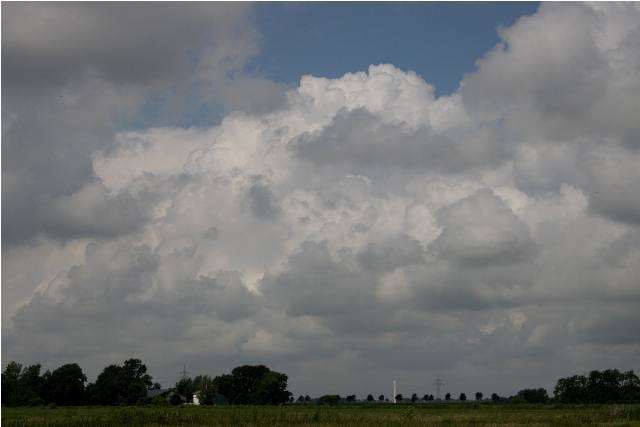 Cumulus congestus Sankt Michaelisdonn 2009
-
 Cumulus congestus Iraklio 2009
-
 Cumulus congestus Rome 2009
-
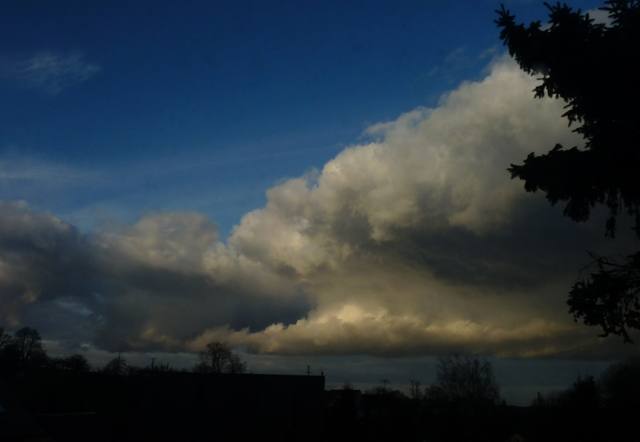 Cumulus congestus Chemnitz 2009
Write a comment or ask a question about this photo
Every comment is read before it is published. Your email address is only needed for the confirmation link and a short message once the comment is online; it is deleted after that.