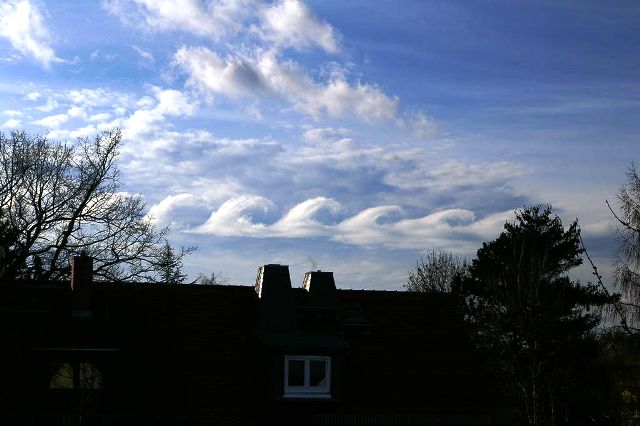
Kelvin-Helmholtz waves
Altocumulus fluctus Ac flu
Genus Altocumulus, Supplementary feature fluctus
Also visible: Kelvin-Helmholtz waves
- Photo
- Michael Popp
- Location
- Leipzig
- Taken
- 6 January 2007, 13:46
Here a particularly pronounced form of a Kelvin-Helmholtz wave, which has formed due to strong vertical wind shear between two air layers.
The weather that day
Large-scale weather pattern
Cyclonic westerly Wz
Lows race from west to east across the North Sea and Scandinavia. Fronts and rear sides alternate: ahead of a warm front, cirrus and cirrostratus thicken into altostratus and nimbostratus; in the cool air behind, cumulus and cumulonimbus bring showers. Changeable and often windy.
Typical clouds in this pattern: Cirrus, Cirrostratus, Altostratus, Nimbostratus, Cumulus, Cumulonimbus, Stratocumulus
The weather pattern describes the flow over central Europe on that day – locally, the sky may have looked different.
The sky at nearby weather stations
In the photo: Altocumulus fluctus · 14:00
Codes = reported genera, grey = estimated only · clear = observer reports no clouds · none meas. = instrument detected none · ? = no data · – = partly hidden or without data (details on hover) · “Photo” = hour the photo was taken.
As under “Identify”: ✓ = reported by a weather station, dots = estimated from height and cover (automatic measurement). The stations see their own sky – not necessarily the cloud in the photo.
Does the weather fit the cloud?
Altocumulus – observed at a weather station ✓ (Leipzig/Halle · 14 km · 13:00) · Reanalysis quite possible · Why?
- Observation: An observer at the Leipzig/Halle station (14 km, 13:00) reports Altocumulus.
- Reanalysis (14:00), quite possible: Middle cloud 37 %. Partly covered: middle cloud patches are usually altocumulus.
Formation: Layer at middle height (2–6 km), usually a few hundred metres thick. Radiative cooling at the top and mixing create small overturning cells – hence clumps, rolls and waves.
Observation before model: what an observer at a weather station reported counts for more than an estimate from a station’s instruments and more than the weather model. Each piece of information counts for less the farther away the station and the further from the time of the photo; the strongest comes first. The ERA5 reanalysis (grid point at the photo location, about 25 km grid spacing) only knows the cover per étage and values at the ground – its level is a rough estimate.
Measurements at the time of the photo
- Temperature
- 10.6 °C · Dew point 4.5 °C
- Humidity
- 66 %
- Wind
- from the west, 12 km/h (Beaufort 2)
- Precipitation
- 2.2 mm over the whole day
Sources: observations and measurements from Deutscher Wetterdienst, the German weather service (CC BY 4.0), Leipzig-Holzhausen (6 km SE); weather pattern after Hess/Brezowsky from the DWD catalogue GWL-REA; ERA5 reanalysis by Copernicus/ECMWF (CC BY 4.0) via Open-Meteo. Times in local time.


Write a comment or ask a question about this photo
Every comment is read before it is published. Your email address is only needed for the confirmation link and a short message once the comment is online; it is deleted after that.