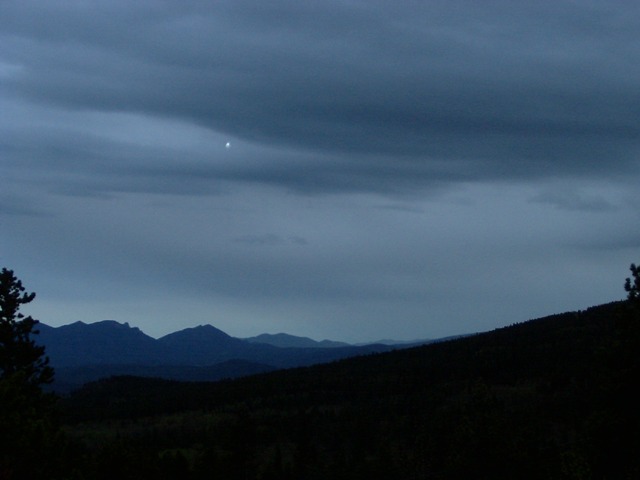
Stratocumulus opacus Sc op
Genus Stratocumulus, Variety opacus
- Photo
- Stefan Bauer
- Location
- Rocky Mountains, Boulder, USA
- Taken
- 22 May 2006
In the upper part of the photo (i.e. in the foreground), the dark, opaque underside of the Stratocumulus opacus is visible. The parallel bands of this cloud are called Stratocumulus radiatus. In the background, Altostratus can be seen.
The weather that day
The sky at nearby weather stations
In the photo: Stratocumulus opacus
As under “Identify”: ✓ = reported by a weather station, dots = estimated from height and cover (automatic measurement). The stations see their own sky – not necessarily the cloud in the photo.
Does the weather fit the cloud?
Stratocumulus stratiformis – according to the reanalysis quite possible (21:00) · Why?
- Station measurement: Atct Rocky Mountain Metro (18 km, 22:00), quite possible: The instrument reports a layer at 750 m, 4/8 covered. Scattered low clouds at night: more likely stratocumulus … The instrument reports a layer at 1,850 m, 7/8 covered. The base lies well above the condensation level of surface air (about 650 m): not a thermal cloud but a layer – stratocumulus. But the observer at Buckley Air Force Base reports Cumulonimbus at this height.
- Reanalysis (21:00), quite possible: 25 % low, 88 % middle, 100 % high cloud. Low cloud without thermals reaching its base: stratocumulus.
Formation: Low layer of clumps or rolls beneath a stable layer (inversion). Forms through radiative cooling and mixing at the cloud top, or when heap clouds spread out under the inversion.
Observation before model: what an observer at a weather station reported counts for more than an estimate from a station’s instruments and more than the weather model. Each piece of information counts for less the farther away the station and the further from the time of the photo; the strongest comes first. The ERA5 reanalysis (grid point at the photo location, about 25 km grid spacing) only knows the cover per étage and values at the ground – its level is a rough estimate.
Measurements that day
- Temperature
- 14.0 to 29.0 °C
- Precipitation
- 10.8 mm over the whole day
Between 14:00 and 16:00 the temperature dropped by 4.0 °C.
Sources: weather reports from the Integrated Surface Database of NOAA (NCEI), Atct Rocky Mountain Metro (18 km SE), Boulder 14 W (23 km W); ERA5 reanalysis by Copernicus/ECMWF (CC BY 4.0) via Open-Meteo. Times in local time.
Similar photos
-
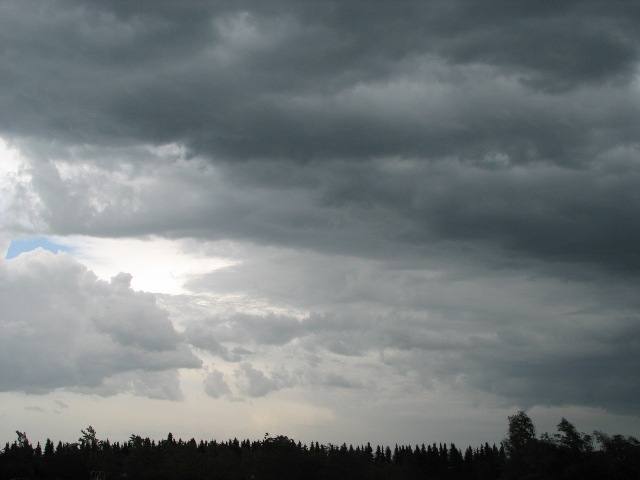 Altocumulus castellanus +2 Weßling 2007
-
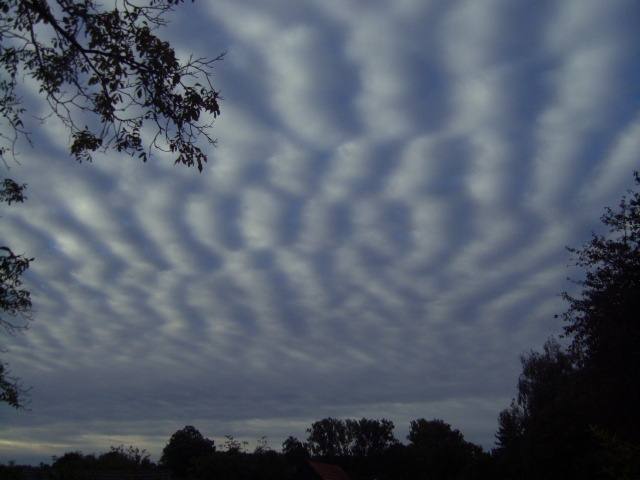 Stratocumulus undulatus Möhnesee 2012
-
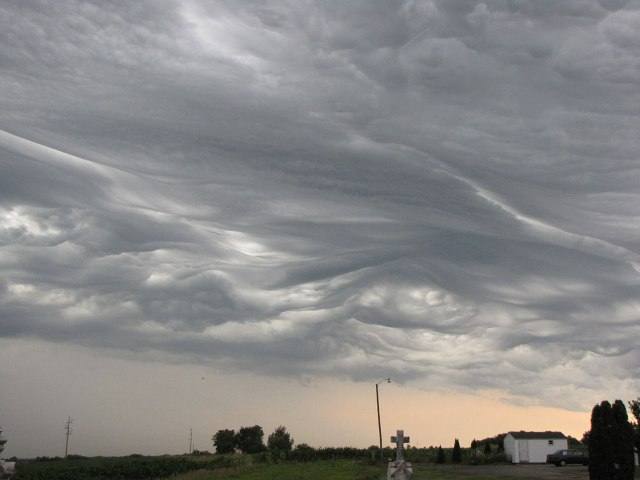 Stratocumulus asperitas St. Matthew's Cemetery 2012
-
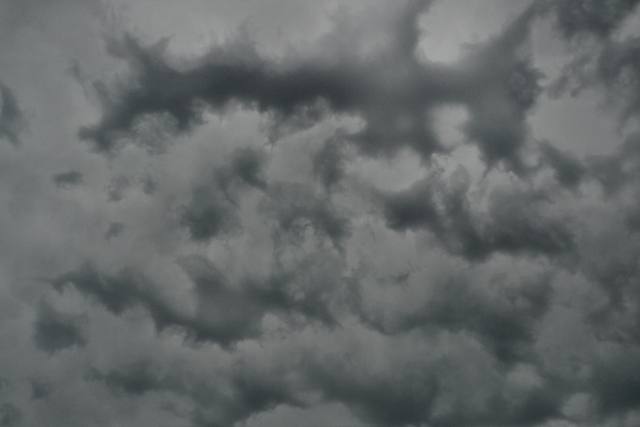 Stratocumulus lacunosus Darmstadt 2012
-
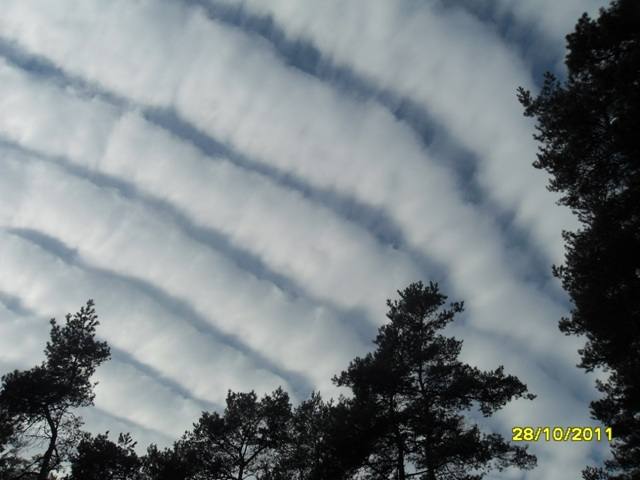 Stratocumulus undulatus Hademstorf 2011
-
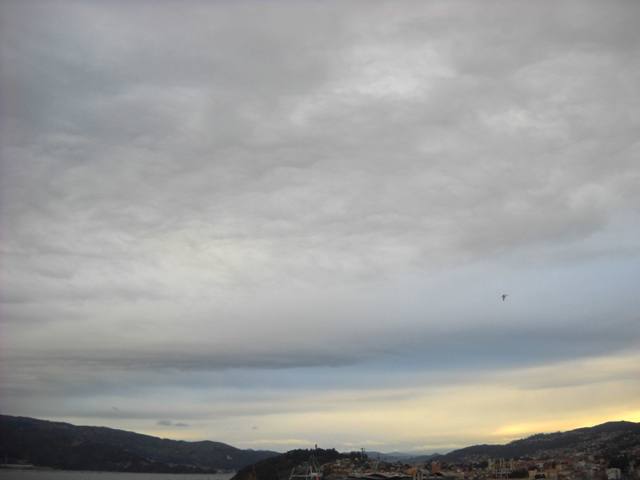 Stratocumulus radiatus Vigo 2011
-
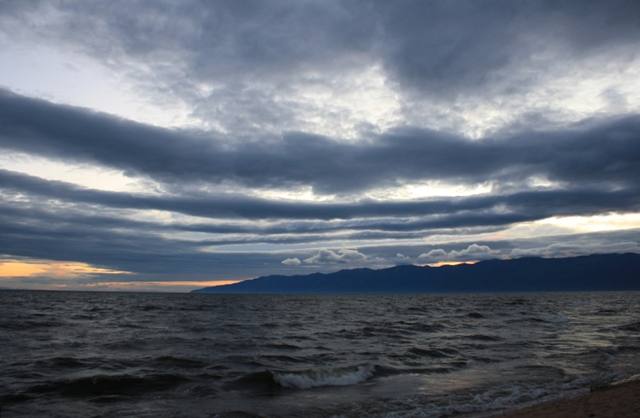 Stratocumulus undulatus Lake Baikal 2011
-
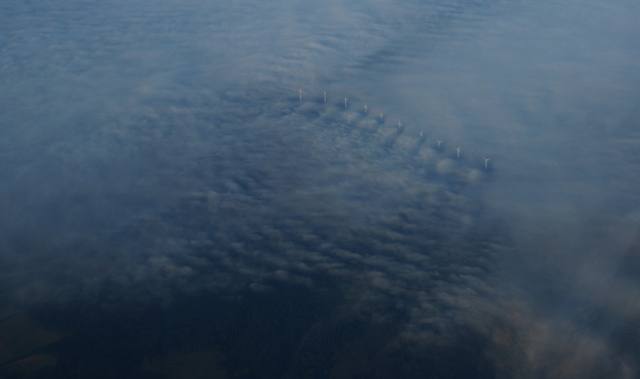 Stratocumulus +1 Rhineland-Palatinate 2011
Write a comment or ask a question about this photo
Every comment is read before it is published. Your email address is only needed for the confirmation link and a short message once the comment is online; it is deleted after that.